
Excel 2013 New Features – Quick Analysis Tool
The Quick Analysis tool as the name suggests allows us to select data on our sheet and then quickly analyse it using the short cut options available to us from the tool.
Once you select your data, if the option is applicable, you will see the Quick Analysis tool appearing in the bottom right of your selection. When you click on this tool the following screen will appear. You can see from this screen that there are 5 possible options.
- Formatting
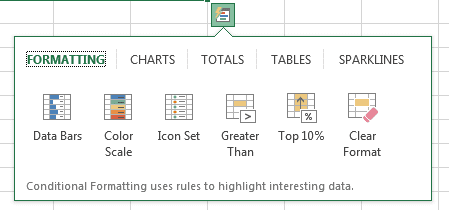
The formatting option, allows you to apply conditional formatting options without having to go to the HOME tab and choosing Conditional formatting. Very quickly you can apply the options of data bars, colour scales and so on. Note that the last icon on the formatting view us clear format, so if you apply a format like Colour scale and then decide you do not like it you can clear it very easily. Also, if you just hover over these icons you will see a preview before you click, as when you click you have applied the format and would need to clear format to delete it.
- Charts
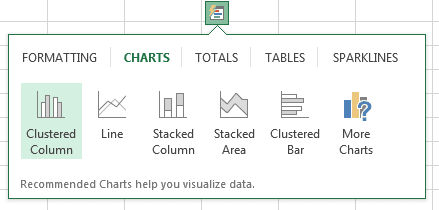
The Charts option, allows you to create a chart from the selected data. Again if you hover over the chart types you will see the chart before deciding on the one to choose.
- Totals
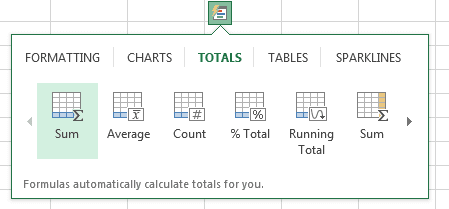
The Totals option, allows you to create a totals line at the bottom of your selected data. For example if you choose Sum when you data is highlighted it would give you a new line of data under your existing data with the sum of each of your columns. Click Average and you will get a new line with the average total at the end of the data and so on. The arrow pointing to the right shows that there are more options on this window, click on the arrow and you will see more total options.
- Tables
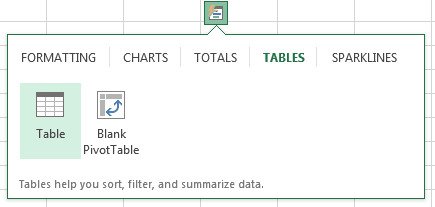
The Tables option, allows you to convert the selected data into a table format. Once in table format, you can use all the tools in the Table Tools tab. It also allows you to convert the data into a pivot table.
- Sparklines
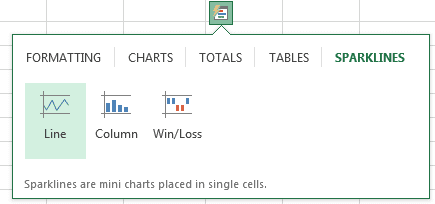
The Sparklines option, allows you to create a line, column or Win/Loss Sparkline in the cells to the right of your selected data. Once the Sparkline is created further options can be accessed through the Sparklines tab.
Be Brilliant at Excel. Save Hours each week and add Professional Certification to Your Resume
Even Microsoft use us to teach their employees Excel
Get access to The Ultimate Excel Training Course Bundle